| Name | Last modified | Size | Description | |
|---|---|---|---|---|
| Parent Directory | - | |||
| Gband-despeckled.fits | 2013-01-11 13:24 | 6.8M | ||
| Halpha-despeckled.fits | 2013-01-11 13:24 | 11M | ||
| RedContinuum-despeck..> | 2013-01-11 13:24 | 4.6M | ||
| Gband-raw.fits | 2013-01-11 13:44 | 356M | ||
| Halpha-raw.fits | 2013-01-11 13:49 | 280M | ||
| RedContinuum-raw.fits | 2013-01-11 13:49 | 280M | ||
| Gband-small.jpg | 2013-01-11 14:10 | 54K | ||
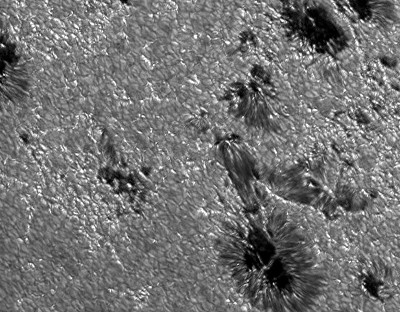
This is an example dataset, containing both the raw data taken with the Dutch Open Telescope, and the result after applying speckle reconstruction. The data was taken on 2010-07-22 at 07:50:29 UT, and shows the active region AR11089.
This dataset contains one "burst" of 140 images, taken very shortly after each other. It also contains data from three different channels: the G-band channel, the H-alpha channel, and the Red Continuum channel.
The G-Band and Red Continuum channels use a fixed filter. The H-alpha channel was tuning through both wings of the H-alpha line during this burst. In particular, it took 20 images each at 7 different wavelengths: -0.9, +0.9, +0.6, -0.6, -0.3, +0.3 and 0.0 Ångström relative to the line core, in that order.
The FITS files with the raw data contain 140 images each. The FITS files with the despeckled data for the G-Band and Red Continuum channel contain 3 images each: the first is the despeckled image, the second is the best image from the raw data, the third image is the average of the raw data. The FITS file with the despeckled H-alpha data is a little bit different: the first image is the despeckled Red Continuum image, the other 7 images are the despeckled H-alpha images for each of the 7 wavelengths.
The despeckled images might be flipped in the X and/or Y axis compared to the raw images.